The Supplier Scorecard: How Bulk Buyers Measure, Rank and Retire Ceramic Factories
A Factory Relationship Decays Without a Scorecard
Most importers keep supplier opinions in their heads: "that factory is good," "that one is slow." The problem is that opinions drift with the last order — one bad shipment and a good factory is condemned; one good shipment and a slow one is forgiven. The supplier scorecard replaces memory with measurement: the same four dimensions, the same weights, scored the same way for every factory, every year. It turns supplier management from a feeling into a process.
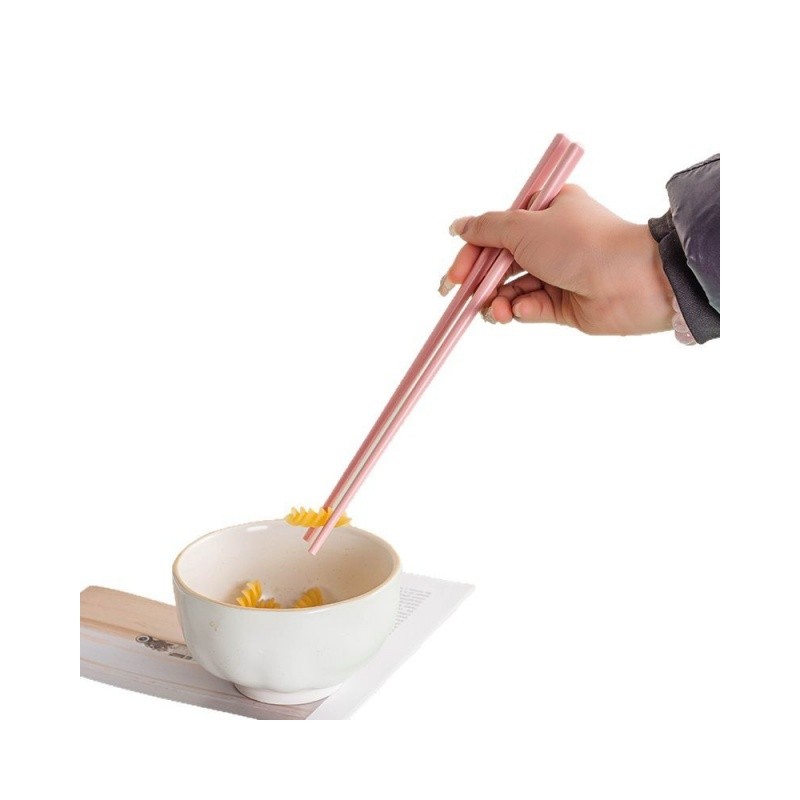
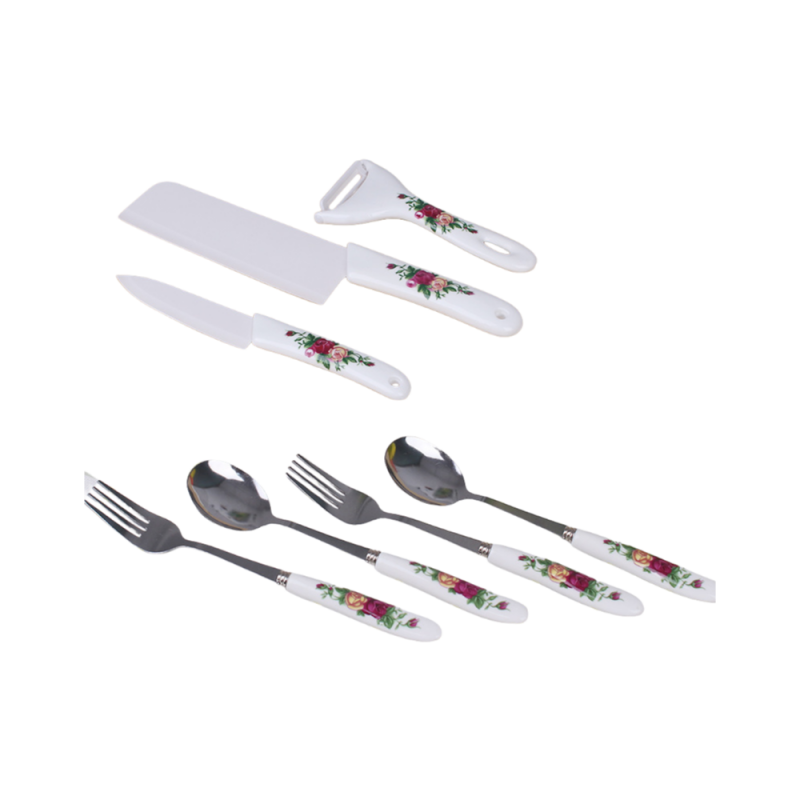
Products in this guide: Vibrant Ceramic Chopsticks Set · 7-Piece Ceramic Knife Set
This guide covers the four dimensions of a ceramic supplier scorecard, how to score objectively, and the three-tier action plan that keeps the factory base healthy.
The Four Dimensions and Their Weights
The scorecard measures what actually determines landed cost and margin. A practical weighting for ceramic sourcing:
- Delivery reliability — 30%. On-time performance against the confirmed shipment date, measured per order. Late ceramic shipments have a specific cost: seasonal stock that misses the window is worth less or nothing. Measure the share of orders shipped on or before the committed date, not the "average delay."
- Quality — 30%. AQL inspection pass rate and defect trends. Score against the approved-sample standard: what share of orders passed the AQL inspection on first attempt, and what was the defect rate per shipment? Two data points — first-pass rate and defect rate — beat any anecdote.
- Responsiveness — 20%. Speed and quality of communication: RFQ response time, sample turnaround, problem resolution time, and whether issues are proactively reported or discovered by the buyer. A factory that hides a delay is more expensive than a factory that is slow but transparent.
- Price competitiveness — 20%. Quoted price against the market and against the factory's own trend over time. The score should reward consistency, not just the lowest quote — a factory that quotes low then raises on reorders scores worse than one that quotes stable.
Scoring Without Guesswork
The scorecard fails when scores are opinions. Make each dimension measurable:
- Delivery: percentage of orders on time × 100. A factory at 92% on-time scores 92 on that dimension.
- Quality: use the AQL outcome — first-pass rate × 100, minus a penalty for critical defects found at arrival.
- Responsiveness: average response time buckets (under 24h = 100, 24-48h = 80, 2-5 days = 60, over 5 days = 40), plus a transparency bonus when the factory self-reports problems.
- Price: compare the quote against the range of your other quotes for the same spec; 100 for the lowest, scaling down to the highest.
Total = 0.30×delivery + 0.30×quality + 0.20×responsiveness + 0.20×price. A score above 85 is a core supplier; 70-85 is a watch supplier; below 70 is a retirement candidate.
The Three-Tier Action Plan
- Tier 1 — Core suppliers (85+): the factories you plan and grow with. They get the volume, the early capacity reservations, and the first look at new programs. Rewarding the top tier is what keeps them loyal.
- Tier 2 — Watch suppliers (70-85): the factories with a specific gap — usually one dimension dragging the score. Give them one improvement cycle: tell them the gap in writing, agree the target for the next review, and re-score after 2-3 orders. Watch suppliers either fix the gap and move up, or stay flat and move down.
- Tier 3 — Retirement candidates (below 70): factories that miss on the fundamentals. The discipline is a written retirement plan: no new programs, existing orders completed, replacement sourced. Retirement is not punishment — it is the scorecard doing its job.
How to Share the Score — and Why You Should
The scorecard is a management tool, not a weapon. Share the scores with your suppliers, and share them constructively: "your on-time delivery was 86% this year, here is what slipped and here is the target for next year." Three effects follow: the good factories compete to stay on top, the watch factories fix their gap, and your sourcing decisions stop being negotiable opinions. A factory that knows it is scored objectively is a factory that behaves.
The Rhythm: Review Twice a Year
Two reviews per year match the ceramic buying cycle — after the autumn peak (Q4) and after the spring peak (Q2). Each review updates the score with the new order data, moves factories between tiers, and sets the improvement targets. The yearly review also produces the two documents that matter: the approved-supplier list for next year's programs, and the sourcing calendar for filling the gaps a retirement leaves.
The Scorecard Checklist
Before the next review, confirm the data is being collected: on-time percentage per factory per quarter; AQL first-pass rate and defect rate per shipment; response-time log (RFQ, sample, problem resolution); and the quote history per spec. Most buyers discover the scorecard's value when they try to fill it and find the data is missing — collect the data with every order, and the review takes an hour instead of a week. A scorecard that runs on data is a process; a scorecard that runs on memory is a mood — and moods are what the scorecard was invented to replace.
"Scorecard-Ready Ceramic Programs"
Explore products featured in this guide:
Have questions? See our Sizes & Finishes FAQ and Ordering & Certifications FAQ.
Need a custom quote? Send an inquiry or browse our full product catalog.